Pluralsight D3 Course
How to make interactive visuals for the web with D3


Having spent a good amount of my life on learning platforms like Pluralsight, it was a pleasure to be allowed to make a course myself. D3.js Data Visualization Fundamentals is what it says on the tin plus some helpful bells and whistles.
As both D3 and data visualisation are heavily interlinked with their contexts, the course covers more than just the D3 tools — it touches on data prep, web technologies, design, perception and a dash of software architecture. Here's a quick run through its chapters...
Covering the Basics
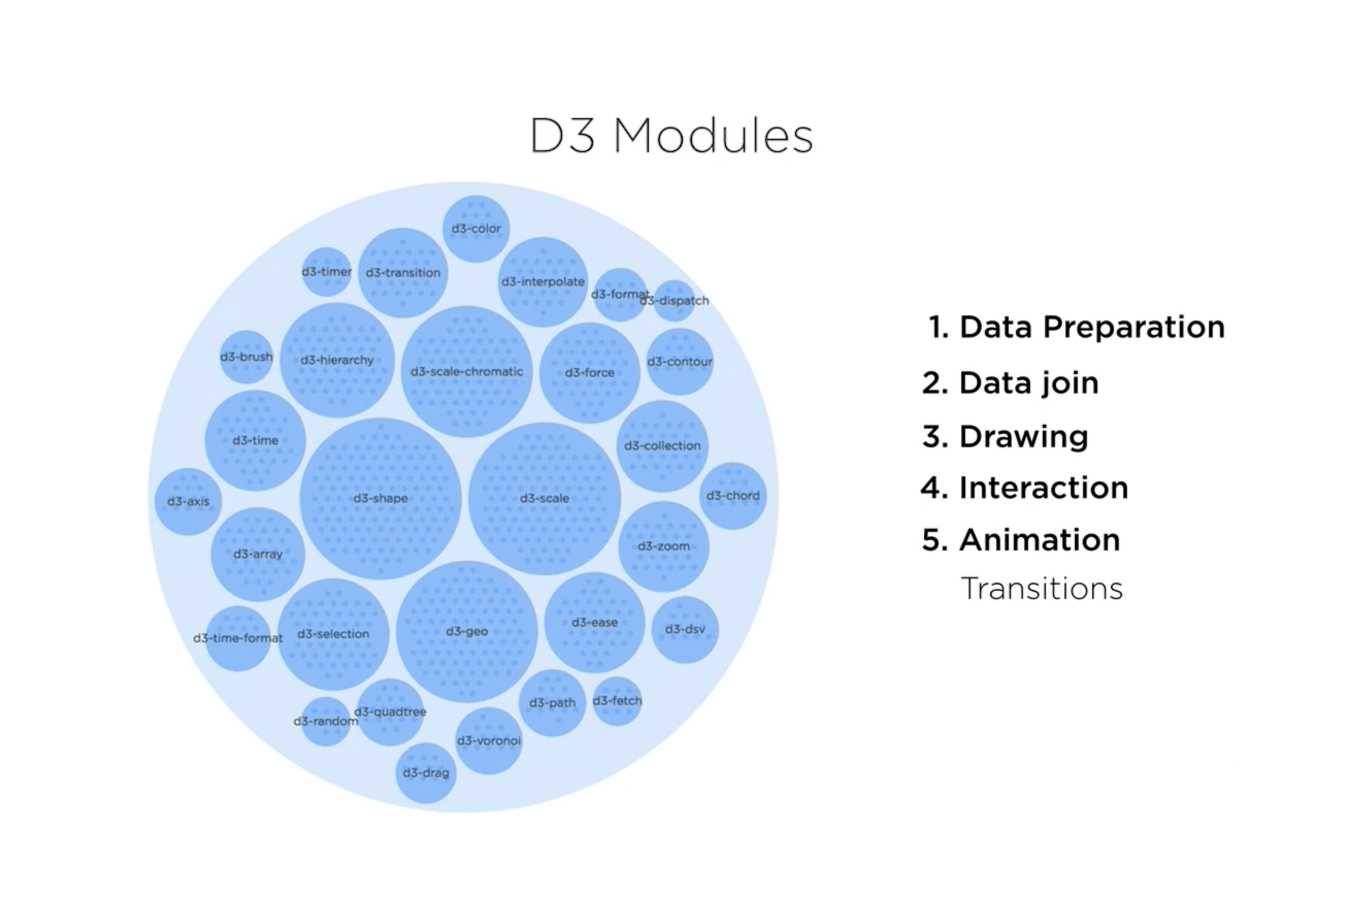
A run through the basics, explaining what it is (a data vis toolbox) and what it isn't (a web framework) and how you can use it. The indiviudal parts:
- What Is D3?
- What's in It?
- Drawing with SVG
- Drawing with D3 and SVG
Shaping the Data
Whenever you build a visual for the web, chances are you need to prepare its data first. That can be as simple as converting your data or as complex as running a neural net on the client. This part runs through a couple of typical but simple prep steps and how D3 can help with them (alas, no neural network).
- Data Overview
- Reviewing the Project's Structure
- Loading Data with D3
- Converting Data Types
- Transforming Data for Your Visual
Drawing a Bar Chart with Data
In this chapter, you'll build a simple bar chart with our previously prepped data. we surely make some bars but equally important are repeating chart elements like axes, headers, labels, as well as the way you can keep track of updates with the D3 data join.
- Bar Chart Anatomy and Setup
- Scaling Data to the Screen
- The Data Join
- Drawing Bars with Data
- Adding Context with Axes and a Header
Making a Scatter Plot and a Line Chart
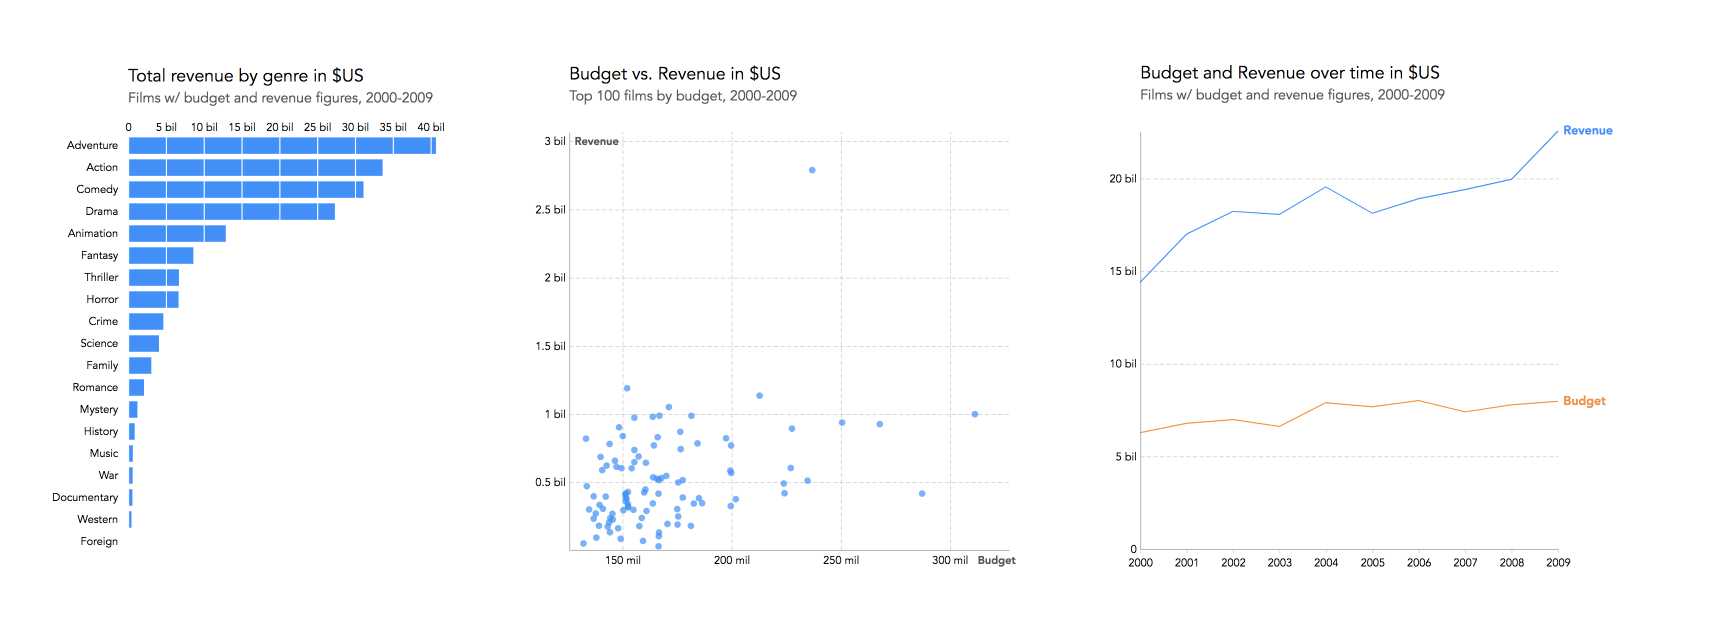
The scatter plot has been described as the fruit fly of data visualisation. Rather common, relatively simple at first sight, but a constant subject of academic study due to its hidden complexities. Well, we make one in this chapter. And a line chart.
- From Raw Data to Scatter Points
- Refining the Scatter Plot
- Line Charts Are a Little Different
- Generating and Drawing Paths
Updating Data
Data often moves and ideally so should its visual representation. It's perceptionally kind to show the user how data transitions from one state into andother and D3 suggests to use something called the General Update Pattern we explain and apply in this chapter.
- From the Data Join to the General Update Pattern
- The General Update Pattern in Code
- Controlling the Update with the Key Function
- Transitioning Change
Updating your Bar Chart
Here we wield the previously learned transition powers to that previously built bar chart.
- Making a Bar Chart of Films
- Updating and Moving the Bars
Adding interactivity
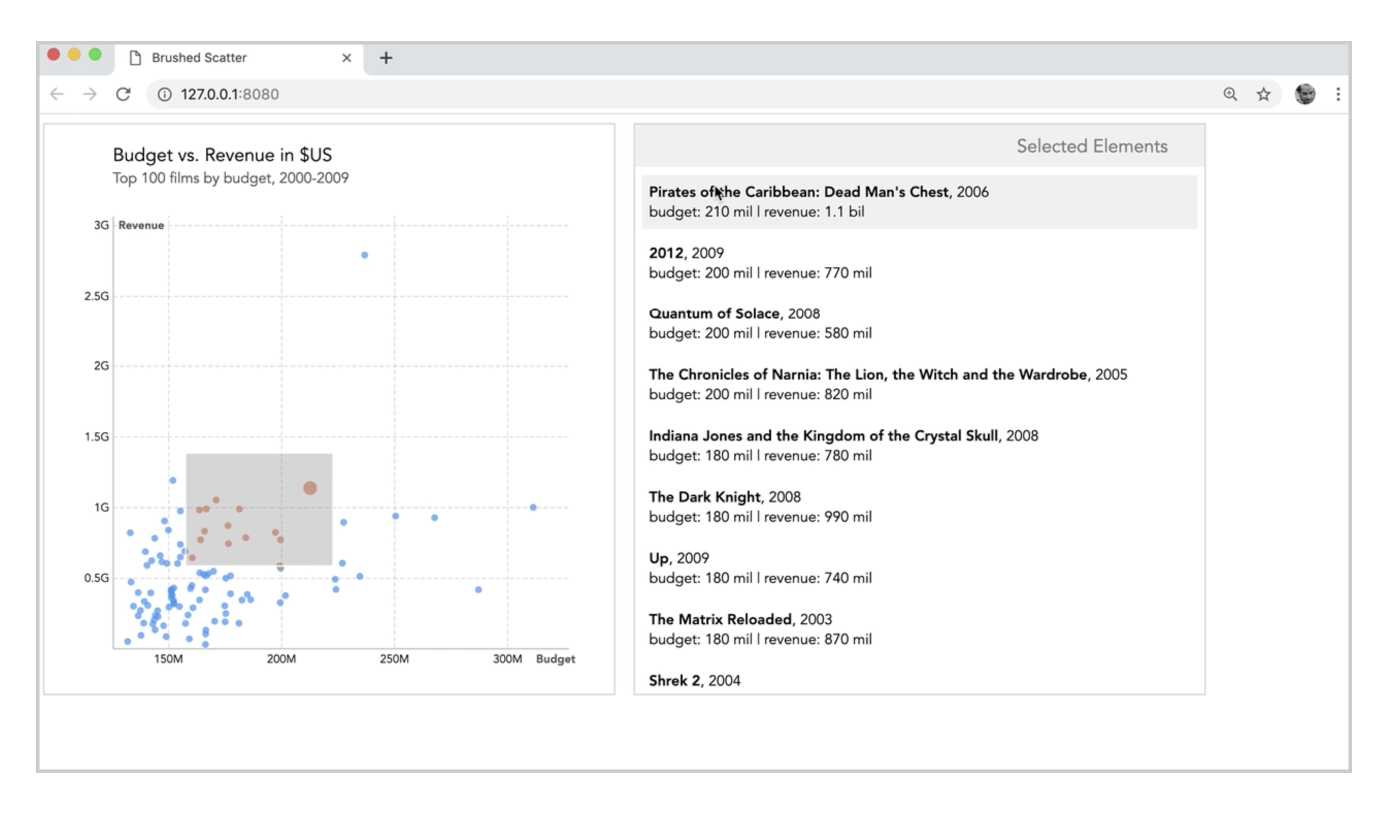
The big benefit of building visuals on the web is taking advantage of the browser's deep interactive well. In this chapter you'll build a tooltip from scratch and use D3's brush module to allow the user to explore the scatter plot.
- Making Your Own Tooltip
- Binding Your Tooltip to Data
- Mounting a Brush
- Using the Brush as a Data Lense
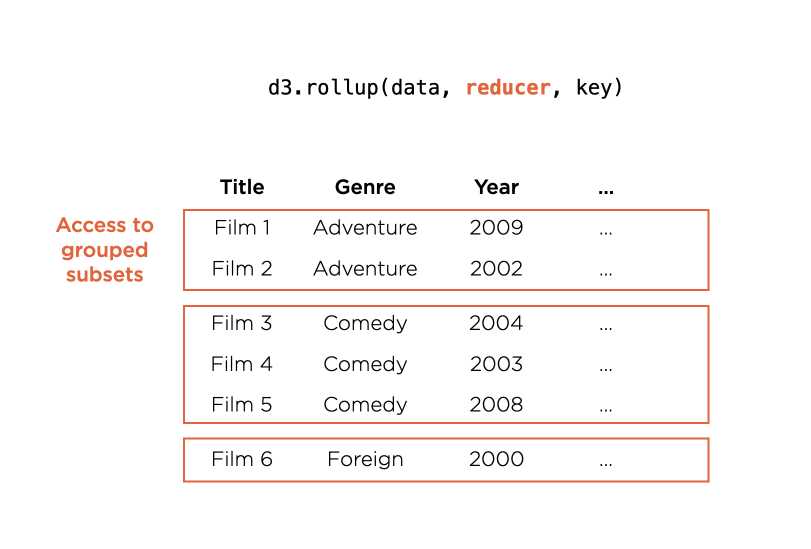
Working with Hierarchical Layouts
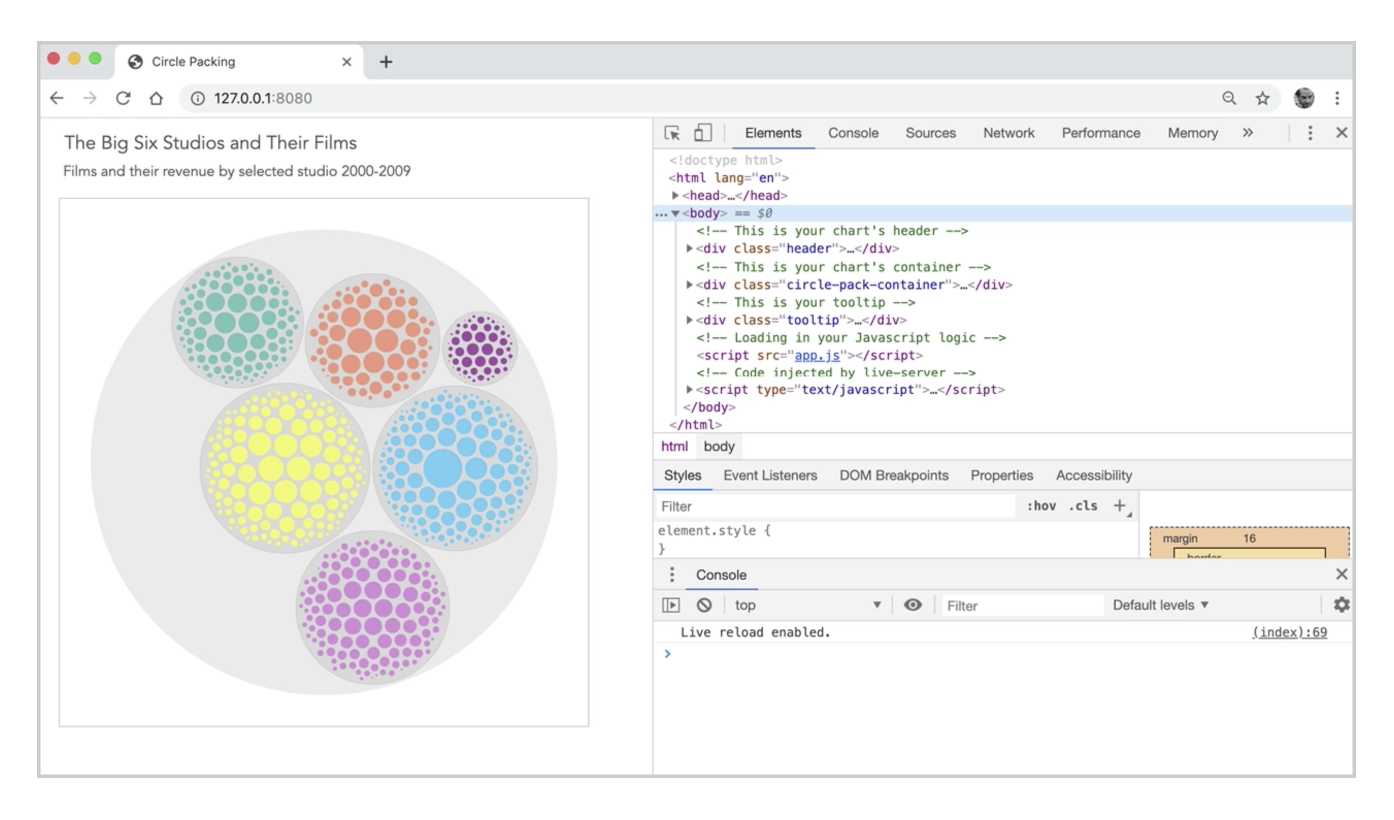
One of D3's key strength is preparing your data for a visual. It can help you calculating the angles of a pie chart, the tesselation of a voronoi diagram, the positions of force-directed networks and more. This chapter looks at the family of hierarchical layouts and how to use them to make a circle packing, a tree map and a simple tree.
- What Is a D3 Layout?
- From Table to Hierarchy
- Making a Circle Packing
- Making a Treemap
- Making a Tree
The Reusable Module Pattern
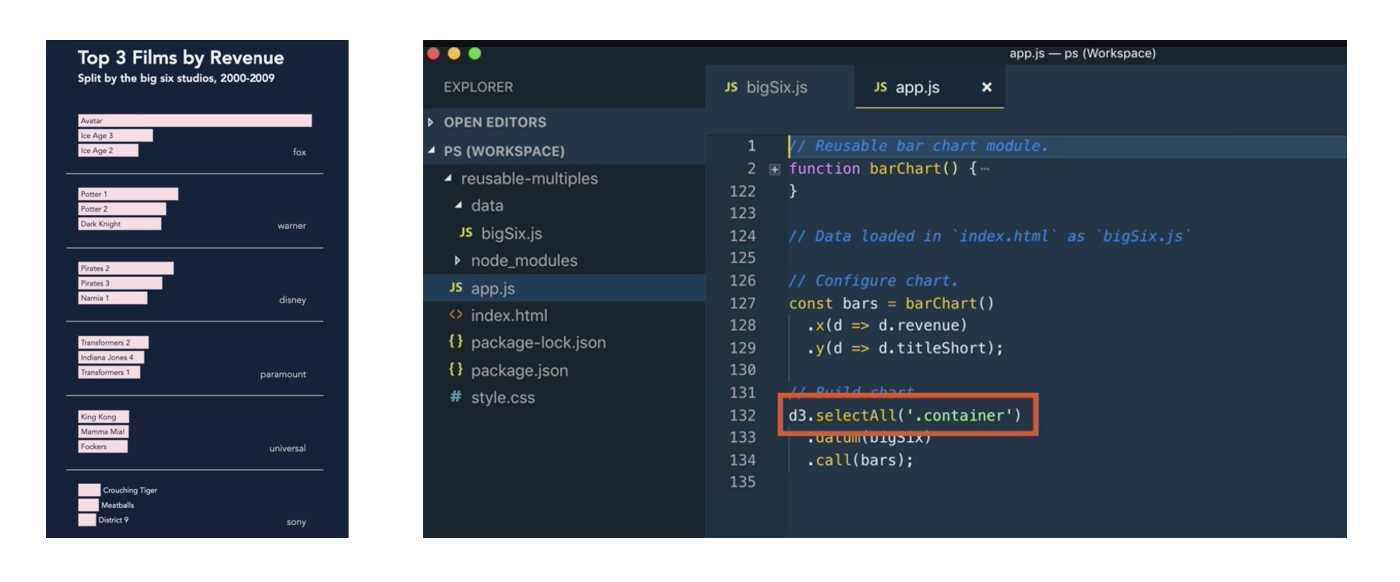
The final chapter is more about your code's architecture than its result. When building visuals, you'd often want to re-use some parts of your code. You might for example want to build multiple bar charts in a grid form each chart showing a facet of your data. The Reusable Module Pattern offers a simple architecture for you to write your code once and reuse it in other places.
- Defining the Pattern
- A Module's Structure
- Adding a Clever Base and Configurations
- Drawing the Chart
- Making Multiples
Head over to the course or just check out the other Pluralsight courses. You'll surely find what you're looking for...