Winter Olympics


Winter Olympics' is an interactive data history of the — well — Winter Olympics. It guides the reader through all the 22 Winter Games that happened since 1922. While passing through, it highlights a few hitherto maybe under-highlighted bits of Olympic history in text and data.
I mainly blame my honest feelings for map design, white sports and visual storytelling for this interactive. And while there might be more pressing topics to attend to at the minute this might offer a brief moment of tranquility.
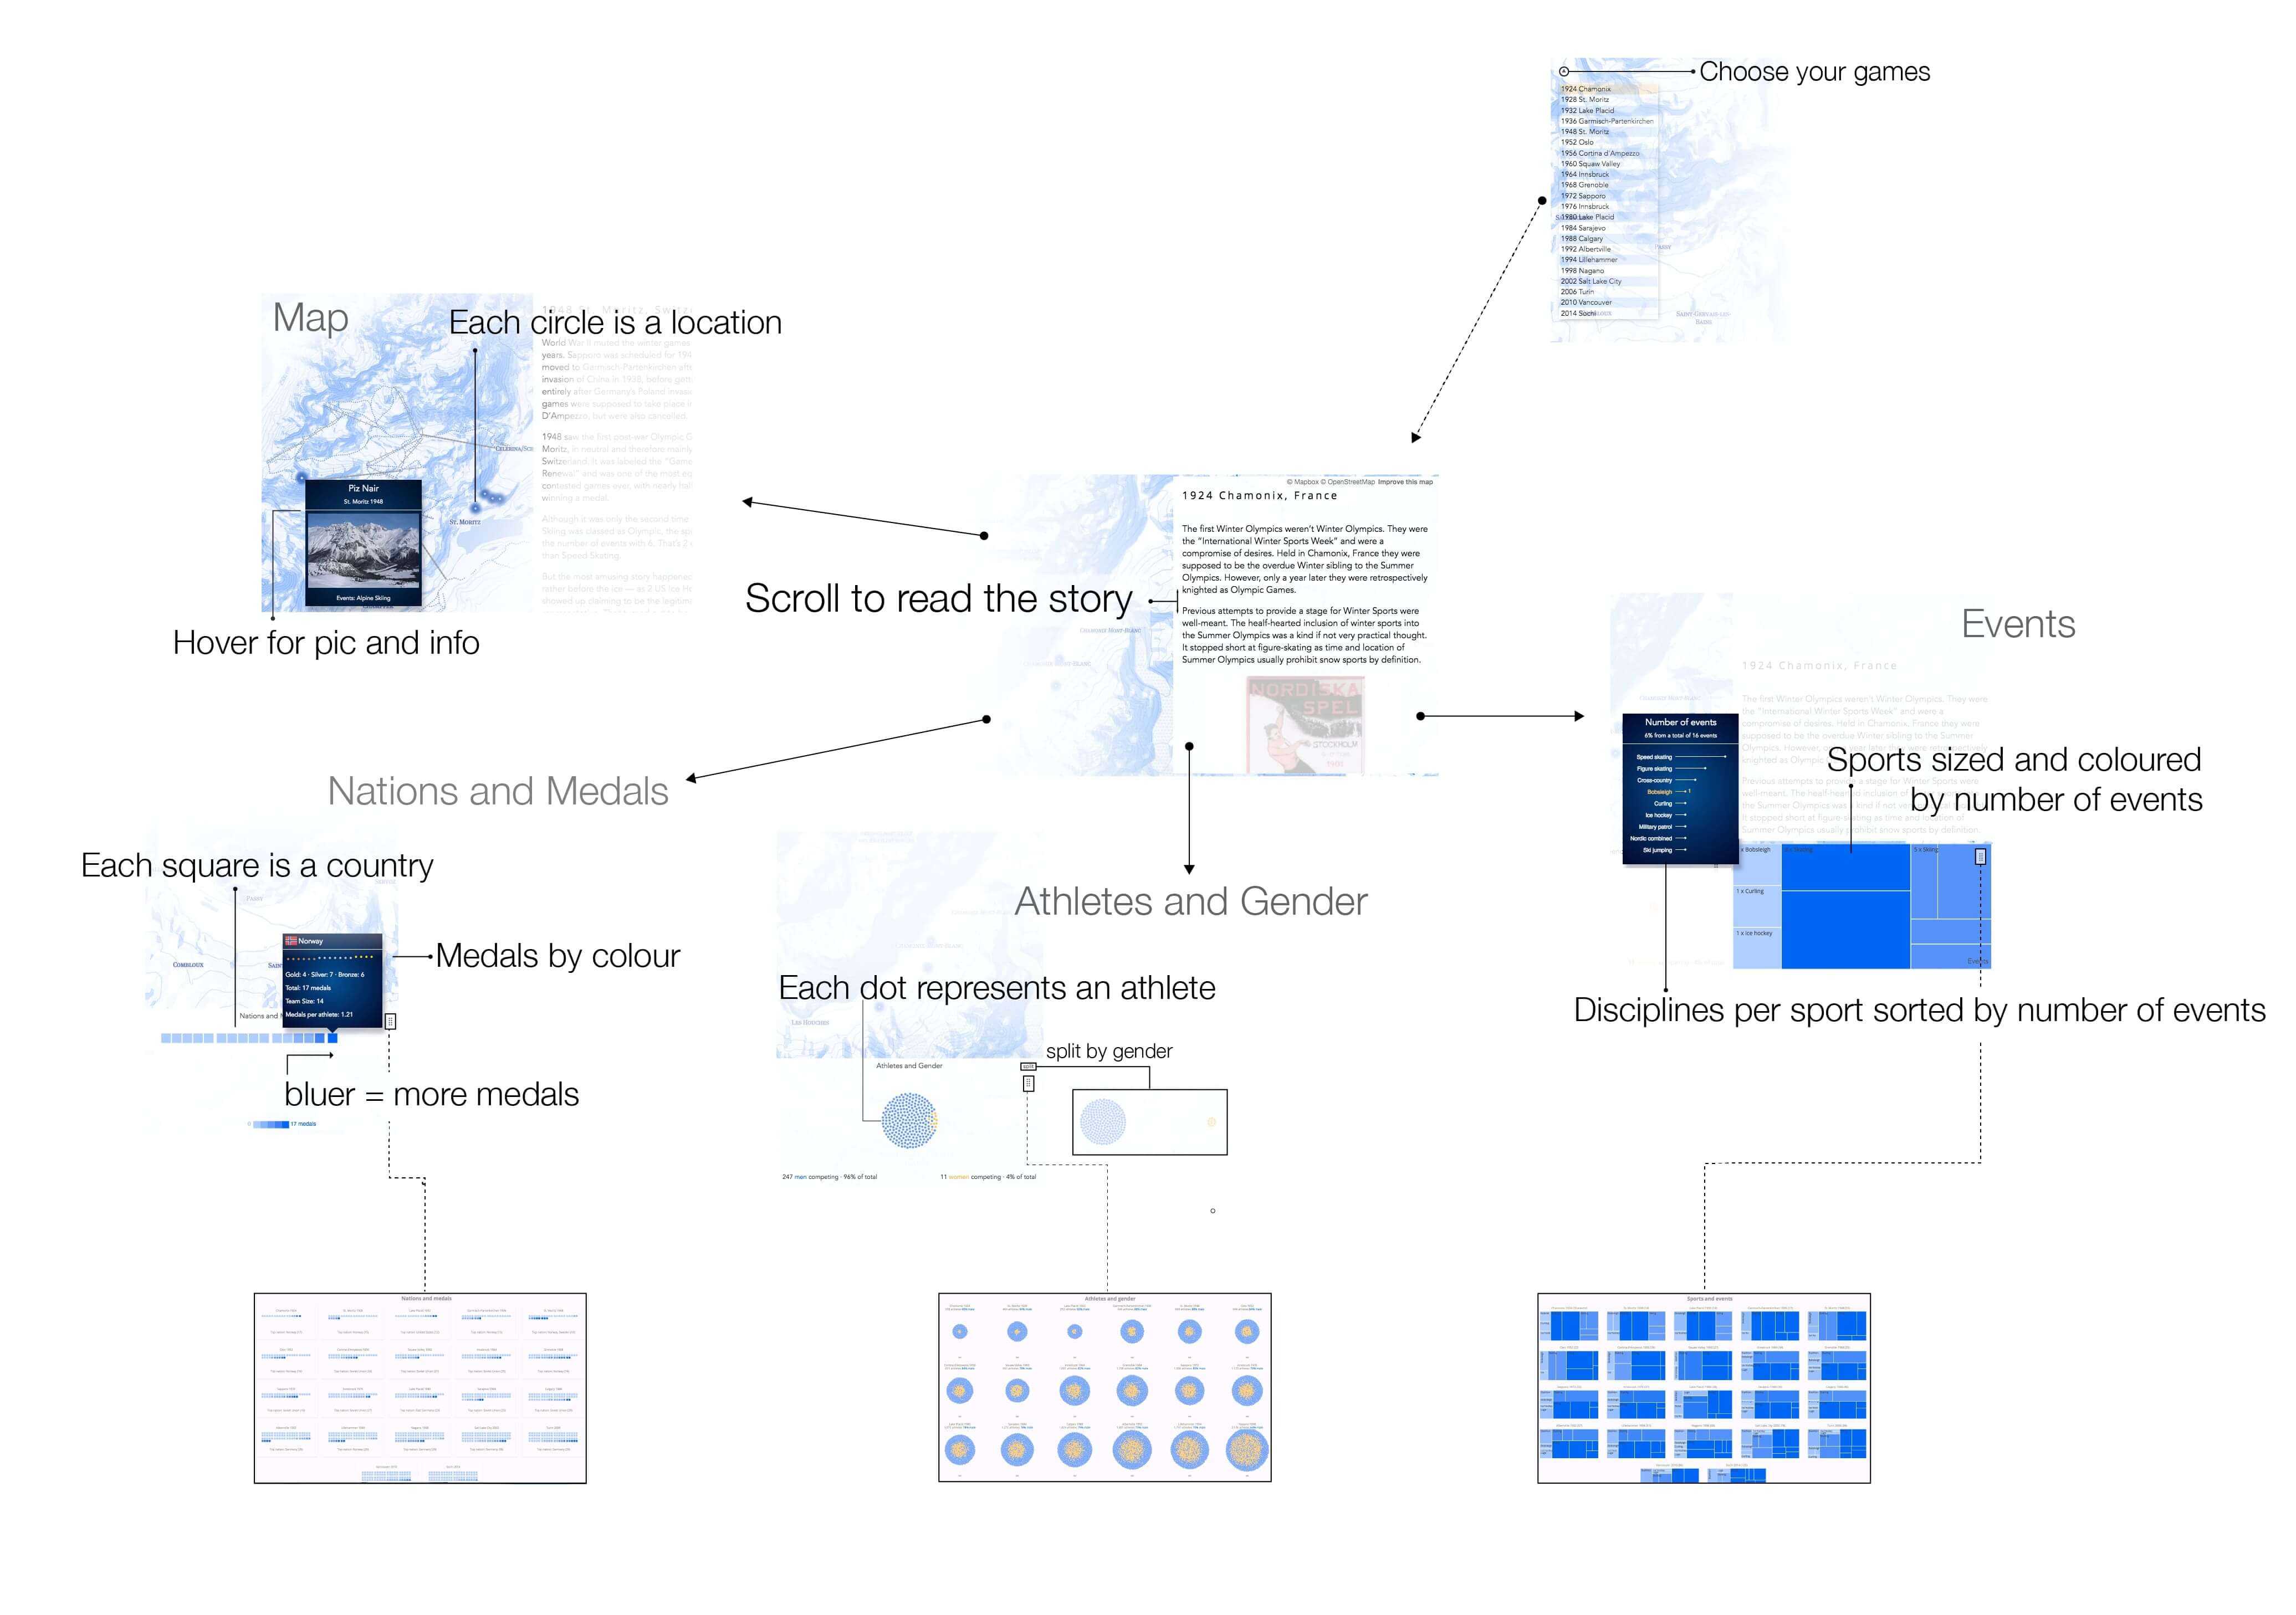
It has 5 moving parts all tightly coupled. The main focus is on the story evolving from the 1922 Games in Chamonix to the 2014 Olympics in Sochi. All other pieces are at the story's service as they update accordingly. The map is gratuitiously flying you to each destination as you scroll along showing all event locations of the respective Olympics. At the bottom are three visual representations of Olympic data:
- The conventional medal count wrapped up in grid-graph.
- A force-directed ball of athletes giving an idea of the number of athletes and their gender,
- and a treemap showing the sports exercised and on hover the individual disciplines per sport sorted by the number of events.
The parts in pictures:
Why do such thing?
Well, thematically, the next Olympics are happening in Feb 2018, so it's time to prepare. Even if you're not a big friend of the Olympics it's an amusing history with a few entertaining facts. And at least equally important than the historical amusement bit was my friendship with data storytelling combined with webGL, canvas and D3. A tasty technical soup to slurp ! I used Mapbox GL to build the map and it was very kind to me. It has a clean, well-documented API with a lot of convenience methods saving sweat and tears. It's based on webGL — the fastest cowboy in town — and uses vector rather than raster tiles to keep the rendering speed up. It also makes map designing a breeze with Mapbox Studio. The fun !
And then there was this map designed by Amy Lee Walton which sparked the idea and fuelled the process. All map design kudos go directly to her...
The data was mainly scraped from Wikipedia and Olympic.org. Much more trawling and data synthesis than analysis for this project. I would have liked to include some more data — especially of the financial kind — as well as a time-series perspective but I refrained to keep the animal in scope.
The process in a gif
Process is interesting. The path from blank slate to finished visual follows numerous intersections producing rich yet usually private monologues. While well-written process notes can illuminate this basement world of the developper/designer (devigner?), a small gif saves some paper for now:
Happy days ! and more to follow probably over at freeCodeCamp